The single thing almost every page about colour prediction pattern tracking gets wrong is the quiet assumption that a record of past rounds contains information about the next one. It does not. Most pages ranking for this topic are built around app downloads, paid “hint” channels and screenshots of winning streaks, and they all skip the question that settles the matter: what connects one round to the next? If the answer is nothing, then no chart, tally sheet or colour grid can tell you what is coming. This breakdown sets out what a round actually is, why recorded history looks informative when it is not, and what record-keeping is genuinely good for.
Table of Contents
Colour Prediction Pattern Tracking Explained
In practice, colour prediction pattern tracking means writing down the outcome of each completed round and then looking for structure in that list. People do it in notebooks, in spreadsheets, in screenshots of the on-screen history strip, and increasingly inside third-party tools that draw the same results as a coloured grid or a line chart. The activity itself is harmless record-keeping. The claim attached to it is where the trouble starts.
The claim takes a few recognisable forms. One is the alternation idea: that colours tend to swap back and forth, so after a run of one colour the other is “due”. Another is the cycle idea: that results repeat on a fixed period, so a long enough record reveals the loop. A third is the heat idea: that a colour appearing more often lately will keep appearing, or conversely that it has been exhausted. These three beliefs contradict each other, which is itself a useful signal. A record cannot simultaneously mean a colour is due and that it is hot.
What the record genuinely is: a list of events that have finished. It is history, in the ordinary sense of the word. History is informative when the thing being recorded has memory, inertia or a mechanism that carries state forward. Traffic on a road has that. Weather has that. A round that is resolved on its own, with no carry-over from the round before it, does not. That difference is the whole story, and it is the part the promotional pages leave out.
It is worth separating two questions that often get mixed together. First, can you find patterns in a recorded list? Yes, easily, and that is the problem. Second, do those patterns continue? That is the question nobody selling a tracking tool answers with evidence, because the honest answer undermines the product. For a longer look at why this pattern of reasoning repeats across every game type, see our breakdown of why betting systems fail no matter how they are dressed up.
One more distinction is worth drawing early, because it clears up most arguments about this topic. There is a difference between a descriptive claim and a predictive one. “Red came up nine times in the last twenty rounds” is descriptive, checkable and entirely uncontroversial. “Red is running hot, so take red next” is predictive, and it needs a mechanism connecting the two statements. Tracking pages slide from the first kind of sentence to the second without ever supplying that mechanism, and the slide usually happens inside a single paragraph. Once you start watching for it, you see it everywhere in this niche.
What an Independent Round Actually Is
An independent round is one whose outcome is produced fresh and is not conditioned on earlier outcomes. The practical test is simple: if you could tell someone the entire result history and it would not change their estimate of the next outcome, the rounds are independent. In colour prediction formats the outcome is generated per round by the operator’s number generation process, settled, and discarded as an input. Nothing about round forty-one is carried into round forty-two.
People find this counter-intuitive because most things in daily life are not like that. If it rained yesterday, rain today is more likely. If a queue was long an hour ago, it is probably still long. Our instinct to read history forward is usually useful, which is exactly why it misfires here. The instinct is not stupid; it is just being applied to the one kind of process where it has no purchase.
There is a second, separate point that matters just as much. Even if some weak statistical quirk existed in the generation process, it would have to be large enough to overcome the built-in margin on every round before it produced anything. The margin is not a rounding error; it is the gap between what a correct call pays and what a fair call would pay. Any detectable tilt would need to exceed that gap persistently, not occasionally. Nothing in a hand-kept colour tally approaches that bar. If you want the mechanical detail of how outcomes are produced, our explainer on how the colour prediction game algorithm produces each round covers it in order.
It also helps to be clear about what independence does not mean. It does not mean outcomes are evenly spread. It does not mean a long record will contain equal counts of each colour, or that imbalances get corrected. Independence is a statement about the absence of a link between rounds, not a promise about how the totals will look. People who expect balance to be enforced are the ones most likely to read a lopsided stretch as a signal, when a lopsided stretch is simply what an unconstrained process produces from time to time.
So the structure of the argument is not “patterns are hard to find”. It is stronger than that: the record is the wrong place to look, because the thing you want to know about has not been influenced by anything in the record.
6 Honest Reasons Tracking Never Works
Here are the six reasons, stated plainly and without hedging. Each one is independently sufficient; together they close the door.
- No causal link between rounds. The next outcome is not a function of previous outcomes, so the input your chart provides is not connected to the thing you are trying to forecast.
- Any finite record contains apparent patterns. Short sequences of coin-flip-like data are full of runs, alternations and near-cycles. Finding one is not evidence; it is guaranteed.
- The patterns are identified after the fact. You pick the rule that fits the record you already have. That is curve-fitting, and it has no predictive content by construction.
- Contradictory rules all look supported. “Due for a change” and “riding the hot colour” can both be justified from the same history, which proves the history is not adjudicating between them.
- The margin applies to every round regardless. Even a perfectly even split of outcomes leaves the expected result negative, so correct-looking calls do not add up to a profit over time.
- Tracking changes behaviour, not odds. People who track tend to stake more on rounds they feel confident about. The confidence is manufactured; the larger exposure is real.
The sixth reason is the one that causes actual harm. A tracking habit creates a feeling of control, and the feeling of control raises stake size and session length. The chart has not improved anyone’s position, but it has made them more willing to commit. That is the mechanism by which colour prediction pattern tracking ends up costing more than not tracking at all.
Notice that reasons one to three are about the data, reason four is about the reasoning, reason five is about the arithmetic, and reason six is about the person. That spread matters. A defender of tracking who answers only one layer has not answered the case. Showing that a record contains a genuine statistical oddity, for instance, leaves reason five entirely untouched, because an oddity smaller than the margin is worth nothing to the person acting on it.
None of this depends on anyone being dishonest. A completely clean, well-implemented generation process produces exactly the same conclusion. The reasons above are structural, not accusations.
Why Colour Streaks Look Like a Pattern
Human pattern recognition is tuned for sensitivity, not accuracy. It is better, in survival terms, to see a shape in the grass that is not there than to miss one that is. Applied to a grid of coloured dots, that tuning produces confident readings of structure in data that has none. This is not a weakness particular to anyone; it is how everyone’s visual system works.
Three specific effects do most of the work. The first is that we badly underestimate how long runs get in genuinely patternless sequences. Ask people to write a “random” list of two colours by hand and they alternate far too much, producing runs of two or three where real sequences routinely produce runs of six, seven or more. So when a real record shows a run of seven, it reads as abnormal when it is ordinary.
The second is selective memory. The times a read worked are memorable because they resolved with a payoff attached. The times it failed blur together. Over a week, recall is heavily weighted toward hits, and the felt hit rate drifts well above the actual one. The third is the near-miss effect: a call that lands one round late feels like confirmation that the pattern was real and the timing was off, which preserves the belief instead of testing it.
The display format adds a fourth layer that is easy to overlook. History strips and colour grids are laid out in rows of a fixed width, which means the same sequence can produce vertical columns, diagonals and blocks purely as an artefact of where the line wraps. Change the row width and the “pattern” disappears or a different one appears in its place. A structure that depends on the number of cells per row is a feature of the layout, not of the results, and it is a good quick check to run on any chart that looks compelling.
Put together, these effects mean the subjective evidence for pattern tracking will always feel stronger than the objective evidence, no matter how many rounds pass. The only correction is to stop relying on recall and look at the full record, including the rounds where the read was wrong. Almost nobody who tracks patterns does this, because the tracking was never set up as a test.
Do Charts Predict the Next Result?
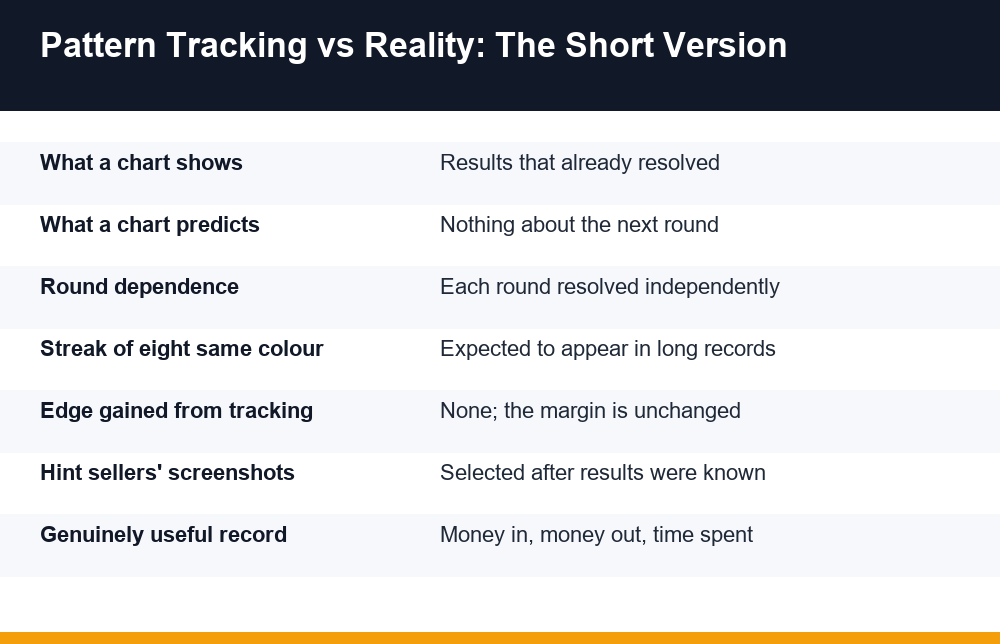
No. A chart is a presentation of settled results. Changing the presentation does not change what the data can support. A list of results, a coloured grid, a run-length histogram and a moving-average line all contain exactly the same information, and that information is about rounds that are over.
The table below sets out the common tracking claims against what the record can actually establish.
| Tracking claim | What it assumes | What the record supports |
|---|---|---|
| A colour is “due” after a run | Outcomes self-correct toward balance | Nothing; each round resolves on its own |
| A “hot” colour will continue | Outcomes have momentum | Nothing; recent frequency is not a forecast |
| Results follow a fixed cycle | A repeating period exists and is visible | Short apparent cycles appear in patternless data |
| Big-small sequences mirror colours | Two displays share a hidden rule | Both displays describe the same settled outcome |
| A chart tool found an edge | The tool tested its rule out of sample | Rules are almost always fitted to past data |
| Longer history gives better reads | More data sharpens prediction | More data gives more apparent patterns, not more signal |
The last row deserves emphasis because it inverts most people’s intuition. Collecting a thousand rounds instead of a hundred does not bring you closer to a working rule. It increases the number of coincidental structures available to be mistaken for one. Volume helps when there is a signal to average out noise around. With no signal, volume only multiplies the false positives.
Smoothing and averaging deserve a note of their own, because they are what makes chart tools look serious. A moving average applied to a patternless sequence produces a line that drifts and curls in a way that looks exactly like a trend, and the longer the averaging window, the smoother and more trend-like it becomes. That smoothness is created by the arithmetic of the average itself, not discovered in the data. Anyone reading a drifting line as momentum is reading the shape of the tool.
The same reasoning applies to every outcome-generation display across the wider category, which our overview of how random number generation works behind casino games works through step by step.
Do Hint Sellers Use Real Pattern Data?
The channels and groups that sell predictions or “hints” do not have access to anything a player does not have. They see the same settled results. What they have instead is a presentation method that makes a guess look like an output, and an audience structure that makes failures invisible.
The mechanics are worth understanding so you can recognise them, not so you can use them. A few recur constantly:
- Split messaging. Different segments of a subscriber list receive opposite calls for the same round, so one segment always sees a correct call and screenshots it.
- Post-hoc screenshots. Winning slips are shared after the result is known; losing ones are never posted, so the visible record is a filtered sample.
- Deleted history. Channels that clear old messages, or post calls in disappearing formats, leave no auditable track record to check.
- Recovery framing. After losses, members are told to increase stakes to “recover”, which transfers risk to the member and keeps engagement up.
- Vague timing. Calls phrased as “soon” or “within the next few rounds” cannot be scored as wrong, so they never fail.
- Deposit-linked access. Paid tiers, referral requirements or deposit conditions attach a real cost to information that has no value.
There is a simple test that cuts through all of it. Ask for a complete, timestamped list of every call made over a defined period, including the losses, published before the results were known. Nobody who is guessing can supply that, and in practice the request is deflected rather than met. Treat an unwillingness to be scored as the answer.
The vocabulary is part of the product too. Words borrowed from trading and analytics, talk of algorithms, servers and “decoded” sequences, and dashboards full of percentages all do the same job: they make a coin-flip guess sound like the output of a process. None of it describes anything that could connect a finished round to an unfinished one, which is the only question that matters. A technical-sounding explanation that never names a mechanism is not an explanation.
It is also worth noting that many of these groups are not primarily selling prediction at all. They are selling access, referrals or paid tiers, and the colour talk is the hook. The pattern language exists because it sounds technical enough to justify a fee.
What Is Actually Worth Recording
Record-keeping is not useless. It is just pointed at the wrong column. The outcome column tells you nothing about the future. The money and time columns tell you a great deal about your own position, and those are the ones almost no tracking tool bothers to show.
A record worth keeping has four fields and takes about fifteen seconds per session: total deposited, total withdrawn, minutes spent, and the mood or trigger that started the session. After four weeks that record answers questions no colour chart can touch. What is the real net figure, not the remembered one? Is spending rising month to month? Are sessions starting after a bad day, late at night, or after a loss? Is the time commitment larger than it felt?
This is the honest reframing of colour prediction pattern tracking. Keep the discipline and the spreadsheet; change what goes in it. Tracking outcomes builds false confidence. Tracking spend produces a number that is hard to argue with, which is precisely why it is uncomfortable and precisely why it is useful.
Two further details improve the record. Write the deposit down at the moment it happens rather than at the end, because end-of-session recall is systematically optimistic. And record withdrawals separately from balance, since an on-screen balance that has not been withdrawn is not money you have.
A monthly total is the single most informative line in the whole exercise, and it is the one people most often skip. Session-by-session figures feel small and are easy to round down in memory; a month added up is neither. Keeping the running total in the same place as the session rows removes the step where a person has to decide to look, and removing that step is most of the point. Nothing here improves anyone’s results, and it is not meant to. It replaces a remembered figure with a recorded one.
If that record shows spending rising, sessions lengthening, or chasing after losses, free and confidential support exists independently of any operator. GamCare sets out the free and confidential support it provides to anyone worried about their own gambling or someone else’s, and nothing about using those resources requires an account anywhere. Real-money play is for adults only, carries risk, and losses are the expected outcome over time.
Mistakes to Avoid When Reading History
Most of the damage done by pattern tracking comes from a handful of specific reasoning errors rather than from the habit itself. Naming them makes them easier to catch in the moment.
Treating a long run as a signal
A run of eight is unusual in any single stretch of rounds and entirely ordinary across a long record. Noticing one tells you that you have watched a lot of rounds, not that something has changed. The strength of the feeling that a change is imminent is not evidence for it.
Raising stakes on a confident read
This is the costliest error. A read derived from history is not more accurate than a read derived from nothing, but it feels more accurate, and stake size tends to follow feeling. The result is larger exposure on rounds where nothing has actually improved.
Scoring the rule only when it wins
If you are going to test a rule, write the call down before the round resolves and score every instance, including the misses. Almost all informal pattern testing records the hits and reconstructs the misses from memory, which guarantees a flattering result.
Assuming two displays are two data sources
Colour, size and number displays in these formats are different labels on the same settled outcome. Cross-referencing them feels like corroboration but adds no independent information, because there is only ever one event behind all of them.
Trusting a tool because it looks sophisticated
A polished interface, percentage confidence scores and live-updating graphs say nothing about whether the underlying rule was ever tested on data it had not already seen. Presentation quality and predictive value are unrelated, and in this niche they tend to run in opposite directions, because effort spent on the interface is effort not spent on a claim that could fail.
The bottom line is narrow and firm. Colour prediction pattern tracking is a record of things that have finished, interpreted by a visual system built to find structure whether or not structure exists. The record is real, the patterns in it are real as descriptions of the past, and neither one reaches forward. Keep the habit if you find it satisfying, but point it at your spend, where it can actually tell you something true.
Frequently Asked Questions
Can you track patterns in colour prediction games?
You can record results and draw charts from them, and in that narrow sense tracking is possible. What is not possible is extracting a forecast from the record. Each round resolves independently, so the list of past outcomes is not an input to the next one. Colour prediction pattern tracking produces a description of history, not a prediction.
Do colour prediction charts predict the next result?
No. A chart is a different presentation of results that have already settled, and changing the presentation does not add information. A grid, a run-length tally and a moving-average line all contain exactly the same data about rounds that are over, and none of them is connected to the round that has not happened yet.
Why do colour streaks look like a pattern?
Because human pattern recognition is tuned to be sensitive rather than accurate, and because people badly underestimate how long runs get in sequences with no structure. Runs of six or seven are ordinary in a long record but read as abnormal. Selective memory and near-misses then reinforce the impression by making hits memorable and failures forgettable.
Is past result history useful in a random game?
Not for forecasting. More history does not sharpen a read; it increases the number of coincidental structures available to be mistaken for a signal. History is genuinely useful for a different purpose: recording what you deposited, what you withdrew and how long you played, which tells you about your own position rather than the next round.
Do prediction hint sellers use real pattern data?
No. They see the same settled results everyone else sees. What makes the operation look credible is presentation: opposite calls sent to different segments of a list, screenshots posted only after wins, deleted message history, and timing vague enough that a call can never be scored as wrong. Asking for a complete timestamped record published in advance, losses included, usually ends the conversation.
What is worth recording if patterns do not work?
Four fields: total deposited, total withdrawn, minutes spent, and what prompted the session. Written down at the time rather than from memory, that record shows whether spending is rising, whether sessions are lengthening and whether play follows losses or bad days. Those are answerable questions, and a colour chart cannot answer any of them.